

It was all a DRReam (DRR.U)
Canadian-listed, micro-cap, US apartment REIT announced strategic review, 25% discount to estimated liquidation value

Illiquidity warning: USD denominated DRR.U trades an average of ~8k shares per day and the CAD denominated DRR.UN trades 4k shares per day!
Summary
Strategic review for sub-scale, externally-managed REIT listed in Canada but owns exclusively US apartments likely to result in M&A or liquidation.
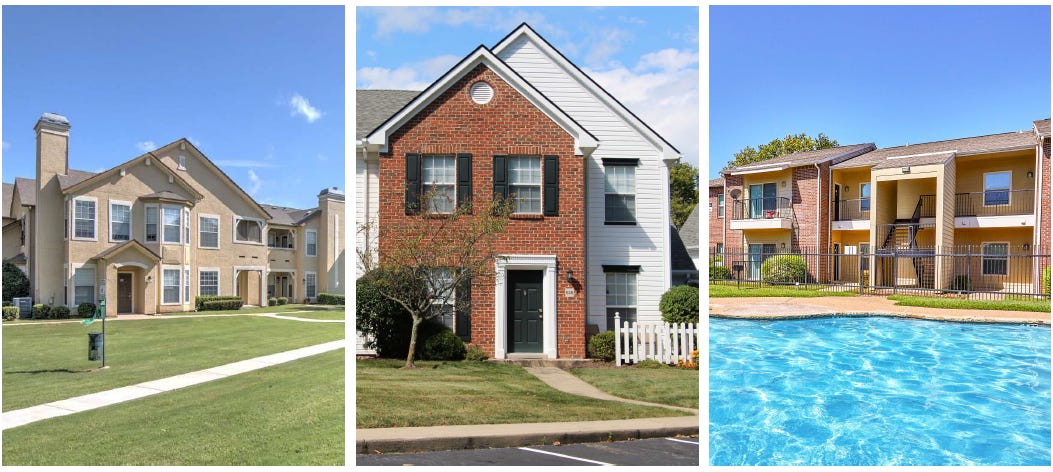
Class B/C garden-style apartments in Dallas - Fort Worth, Oklahoma City & Tulsa, and Cincinnati, average age of 40 years.
At $8.25 per share, trades at an implied 8.3% cap and $92k per unit, a 25% discount to my liquidation value estimate of $11 per share (6.6% cap rate and $110k per unit).
Portfolio sale or liquidation over the next 12 - 24 months combined with in-place 5% dividend yield results in 20% - 40% IRR.
Next buyer gross IRR estimate of 15% with unheroic assumptions (no NOI growth in 2025, 3% thereafter, and no cap rate compression at exit) supported by falling supply in their markets and falling financing costs for apartments.
External managers own 21.3% of the REIT units and combined with my assumption of an onerous, asset management break fee, incentivizes a sale netting them proceeds equivalents to ~10 years of management fees and costs.
Background
Dream Residential REIT is a small (US$170m market cap) REIT listed in Canada and externally managed by Dream Unlimited Corp and Pauls Capital. It was formed by the merger of American Workforce Housing L.P., a vehicle managed by Pauls Capital, and assets owned by Dream and IPO’d at US$13.00 in May 2022. Throughout this write up, all figures will be in USD despite the fact there are also units listed in CAD (DRR.UN).
This proved to be a very poor time to list a portfolio of Class B/C apartments in the sunbelt and mid-west due to the impact of rising interest rates and a significant wave of new apartment supply in the US. The shares have… not done well.

Source: Tikr
The original plan was to grow the portfolio through acquisitions. However, this immediately fell through due to high cost of debt (financing rates exceeded property cap rates for most of 2022 - 2024) and equity as the REIT traded at a deep discount to NAV and a high implied cap rate and dividend yield. As a result, the company has languished in value trap land as a sub-scale, externally managed REIT.
In combination with their 2024 annual results, the REIT announced the initiation of a strategic review in February to address the persistent discount between the REIT’s trading price and its net asset value per unit (based on 3rd party and management appraisals required under IFRS) as well as the Board and management’s view of the REIT’s intrinsic value. This announcement spurred the pop in the share price at the far right of the chart above. Subsequently, on March 11th, the REIT announced that the Board retained TD Securities as its financial advisor.
I think the Board and management have called time on this venture and the outcome of the strategic review will be a sale of the portfolio or an orderly liquidation.
Portfolio and valuation
Despite a ~25% rise in the share price year-to-date, I think the portfolio still trades at an attractive valuation and discount to its private market value.
Dream owns 15 Class B/C, garden apartment properties with 3,300 units across greater Dallas Fort Worth, greater Oklahoma City (includes Tulsa), and greater Cincinnati (includes Dayton, OH and Lexington, KY). Make no mistake about it - these are far from trophy assets. They are older properties (built in 1986 on average, so ~40 years old) that command lower rents (and as a result, lower NOI margins) and will require more maintenance CAPEX than new or Class A apartments.

Sources: Dream Residential REIT Q4 2024 Presentation
The portfolio’s weighting to Oklahoma City / Tulsa and Cincinnati / Dayton has helped performance through the current wave of high new apartment supply in the US sunbelt. These markets saw less of a rent spike during COVID than sunbelt markets like Dallas, Austin, Nashville, and Charlotte, which are now seeing large waves of supply in response. Monthly rents grew at ~3% in 2024 compared to remaining effectively flat in Dallas - Fort Worth.

Sources: Dream Residential REIT Q4 2024 Presentation
Cincinnati in particular did well with both new and renewal lease trade outs positive in Q4. This was supported by continued renovation spend in this market, which they halted in OKC and DFW due to returns falling below their target 12% - 16% threshold.

Sources: Dream Residential REIT Q4 2024 Presentation
At a share price of $8.25, the portfolio trades at an implied cap rate of 8.3% based on Q4 2024 NOI and $92k per unit. It screens cheap based on a 12.0x FFO multiple but assuming maintenance CAPEX at 20% of NOI results in a ~19x AFFO multiple, which is not cheap relative to the wider US multifamily listed peer set. The dividend, which yields ~5%, is just about covered by AFFO.

Despite the recent run-up in price, the portfolio still looks cheap relative to peers in the US and the private market.
The best two listed peers in my opinion are Nexpoint Residential Trust (NXRT, $1 bn market cap), which is also externally managed and focuses on Class B sunbelt apartments, and BRT Apartments (BRT, $340m market cap), which is internally managed but has its own governance issues and question marks and a similar market focus. The profile of both these portfolios is pretty similar to DRRs but a little higher quality. Monthly rents in Q4 2024 were $1,491 for NXRT and $1,405 for BRT and the average age of the BRT portfolio is 21 years (NXRT does not disclose this metric).
At $38 per share, NXRT trades at an implied cap rate of 6% and ~$190k per unit. BRT trades at $17.50 per share, reflecting a 7.2% implied cap rate and ~$130k per unit. Both pay a slightly higher dividend yield of 5.4% and 5.7% respectively but employ significantly higher leverage: ~12x net debt / EBITDA and 60% net debt / enterprise value for both.

I estimate that DRR’s portfolio is worth a ~6.5% cap rate and ~$115k per unit. I have assumed cap rates that reflect a spread over private market cap rates, which based on two sources range between 5.3% and 7.5%, to account for the age, quality, and location of the properties which I believe is in the below average but not terrible range.
These cap rates all reflect a significant discount to Class A apartments in the US, which are about 5% as evidenced by transactions across a range of both coastal and sunbelt markets.

Source: Bank of America Global Research
My property value estimate results in an estimated liquidation value per share of ~$11.00. I anticipate that any sale or liquidation will involve a cozy deal for the external manager, so I have assumed they get paid their current annual fee, undiscounted, for the remaining life of the management contract as a break fee. I have also assumed a 3% frictional sale cost reserve, each of which totals ~$0.50 per share or ~$1 per share in aggregate.
In conjunction with the ~5% dividend yield, based on my assumptions, a sale or liquidation over the next 12 - 24 months would represent a 20% - 40% IRR.
My property value estimate reflects a 5% discount to the IFRS “fair value” of the portfolio and my liquidation value estimate is a 18% discount to IFRS NAV per unit. This is based on a combination of third-party appraisals and management estimates. During Q4 2024, 6 properties representing 31% of the portfolio by fair value were externally appraised.
About half of the gap between my liquidation value and IFRS NAV per share is my assumed AM break fee and sale / frictional costs. Adjusting for those costs, if the IFRS fair values for the portfolio are achieved in a sale, this would represent liquidation value of $12.35 per share or ~12% upside to my estimate.
There are not a lot of good data points to handicap how conservatively or aggressively the portfolio is being appraised. There is only one minor transaction to point to, when in November 2023 Dream sold their only property in Wichita, KS for $9.0 million, which comprised 132 units built in 1983. The sale price was 3.3% higher than the IFRS “fair value” for the property in Q3 2023 and represented $68k per unit and a cap rate of “around 6%” on trailing twelve month NOI.
While far from representative of the rest of the portfolio due to its location and small size, it’s a positive sign that this sale was at a premium rather than discount to IFRS “fair value” and at a lower cap rate than I have assumed for the rest of the portfolio.
Why now?
Management taking real steps towards pursuing a sale or liquidation of the company creates a catalyst that makes this former value trap an interesting opportunity.
I also think the probability of a successful portfolio sale or a liquidation of the REIT through has increased as operating conditions show signs of improving this year and financing costs have declined.

Sources: Dream Residential REIT Q4 2024 Presentation, (1) CoStar
After peaking in 2024, new multifamily supply in Dream’s markets will fall through 2025 and 2026. This is virtually guaranteed based on starts and the fact that it takes about 2 years to deliver a new apartment building. New starts have fallen by ~50% from their peak in 2021 and remain at low levels, limiting supply 2+ years out. The CoStar forecast above for supply to start rising in H2 2026 and 2027 may prove to be too high unless we see a rebound in starts.

Sources: MMG Partners 2025 Forecasts
This year will remain challenging as newly-delivered supply leases up but a next buyer will be looking out to a period of potentially very low supply in 2026 and beyond, which would support rent and NOI growth.

After rising since 2021, financing costs for US multifamily have started to decline. This is particularly true when looking at the rates for multifamily agency mortgages, which are backed by a GSE like Fannie Mae or Freddie Mac. Multifamily is unique among commercial real estate sectors in having access to this type of mortgage, which supports the availability of debt financing, even in challenging environments. Rates peaked in Q4 2023 at 6% and fell by ~50 bps through 2024. The improving financing environment is further evidenced by rising LTV ratios, which exceeded 65% for multifamily loans for the first time since 2021 and the compression of spreads, which fell to below 160 bps in Q4 2024 (CBRE US Capital Markets Report).

I think a next buyer is looking at a ~15% 5-year gross IRR with a 7.7% initial cash on cash yield based decidedly unheroic assumptions: no NOI growth in 2025 and 3% thereafter, 6% cost of debt at 65% LTV, and no cap rate compression.
For simplicity I assumed a buyer can get interest-only financing but assumed a higher rate than seen in Q4 2024 for agency mortgages. The interest coverage ratio indicates that a buyer could get higher leverage than the 65% assumed here. Even if financing required 30-year principal amortization with the same 6% interest rate, the debt service coverage ratio would be 1.4x above typical lender requirements of 1.2x.
Management incentives
The REIT is externally managed by a ~50/50 JV of Pauls Capital and Dream Unlimited. The management agreement has an initial 10-year term through 2032 with a fee structure that doesn’t align them well with shareholders:
An asset management fee equal to 0.25% of the valuation at IPO for the initial properties and purchase price of other properties.
An incentive fee of 15% of FFO that exceeds $0.72 per unit, which increases annually by 50% of US CPI (they are not currently achieving this threshold).
CAPEX fee of 5% of construction costs for projects in excess of $1,000.
Acquisition fee of 1% of first $100k of properties acquired in a year, 0.75% of the next $100k and 0.50% in excess of $200k.
Financing fee equal to actual expenses incurred.
There are no explicit provisions for termination in the event of a change of control for the manager or key personnel.
Based on the management contract alone, the manager has no real incentive to pursue a sale or liquidation and close the discount to NAV / liquidation value.
However, Dream and Pauls own 21.3% of the REIT units. Assuming a liquidation at my ~$11 per unit estimate, the value of their owned units would increase by ~$10.7 million. Adding in my punitive asset management break fee assumption, which represents another ~$9m, they stand to make about ~$20m in a liquidation, which represents ~10x the annual management fees and expense reimbursements they receive from the REIT. I can see how unlocking this value now could make sense as opposed to clipping the management fee coupon from a sub-scale REIT that’s unable to grow.

Risks, mitigants, and downside
Self-dealing by external manager. Pauls and Dream take the REIT private at a below-market price in order to continue to control and charge a management fee on the assets. The Board is not truly independent - out of 5 directors, one is Brian Pauls, CEO of the REIT and son of the founder of PaulsCorp / Pauls Capital and two are former management / current board members of other Dream-sponsored REITs. I think the mitigant here is the fact that this is the smallest of Dream’s externally managed REITs with their larger REITs, Dream Industrial and Dream Office, having enterprise values of CAD 6.3bn and CAD 1.6bn respectively. A self-dealing transaction could “taint” their other public vehicles, which are worth a lot more to Dream than this REIT, limiting their performance and future growth prospects.
Lower quality assets only attractive to high cost of capital buyers. The buyer pool for Class B/C properties may be thinner than I expect and my estimated cap rates may be too low. Based on the current share price, in place debt and my AM break fee and sale / frictional cost assumptions, if the portfolio is sold for less than $330m, which represents a 7.6% cap rate and $100k per unit, shareholders will lose money. I think the chances of this are remote.
Market conditions worsen, no deal is possible or assets can’t be sold. The two largest macro risks to a sale in the next 12 - 24 months would be either a recession that causes significant job losses in their markets, affecting demand for apartments, or a sharp rise in interest rates, which would increase financing costs and create uncertainty around market values. I don’t view this as likely but it’s possible and more likely to affect a sale of the whole company / portfolio than individual asset sales.
If the strategic review ends without a sale of the assets, the REIT will go back to trading based on dividend yield. Assuming no growth in the dividend in 2025, a 6% yield would result in a share price of $7 (~20% share price downside) and a 7% dividend yield would result in $6 per share (~30% share price downside). Dividends collected in 2025 would help offset this downside.

Source: Tikr
Importantly, DRR has no debt maturities in 2025 or 2026, which gives them a good runway in the event of an interest rate shock or economic downturn. Approximately $35m of debt ($20m of mortgage debt and their revolving credit facility with a $15m balance) matures in 2027. Their mortgage debt is fixed at a weighted average rate of 4.0% and the credit facility is floating rate at SOFR + 185 bps (~6.15% at current SOFR).

Good article. NCP is long!
Thanks for the article. You mention that "CAPEX at 20% of NOI results in a ~19x AFFO multiple" at the current share price, but the IFRS fair value is 40-50% above that price. So someone paying IFRS fair value is paying an AFFO multiple in the upper 20's. Are there really buyers willing to go anywhere near that, for B/C assets?